(2018-July-25) I like the ESRI company slogan, "The Science of Where". Hopefully, it will help someone not to get lost in the myriads of geo points on their maps.
Working with ArcGIS map visualization in Power BI, you always hit that notification point that tells you about more features available in the non-free version of the ArcGIS map, so I wanted to explore this.

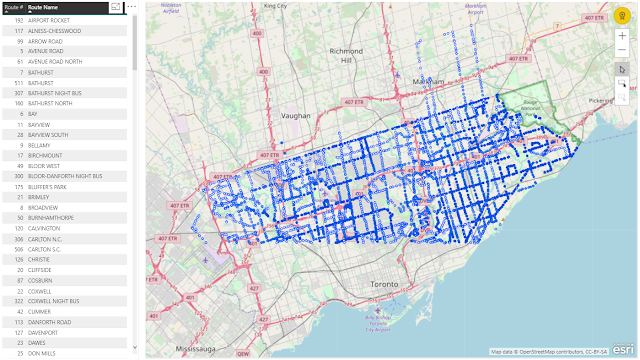
I pulled an opened dataset of TTC Routes and Schedules with the route definitions, stop patterns, stop locations, and schedules of the Toronto TTC ground buses and streetcars into my Power BI data model.

With the following table count statistics:
Stops - 10,614 records
Trips - 134,949 records
Routes - 200 records
Stop Times - 5,584,011 records
And this data model helped me to plot all (almost all) stops' geo locations in my ArcGIS map:
My next step was to sign up for the Plus subscription (Paid version of the ArgGIS map) in Power BI. The registration went smoothly, my credit card information has been collected, no warning signs. However, when I tried to sign in again and authenticate myself with my registration email address, I received an error message that something went wrong with ArcGIS Maps for Power BI with apologies for the inconvenience and request to refresh the page or check back later. I contacted the Canadian ESRI tech support but still haven't received any updates for this issue.
So, I was only left with the option to trust the ESRI documentation and check limitations of the free version of the ArcGIS Map in Power BI. If you read the documentation, basically you will get an idea of "more", there a couple of additional new features, but the Plus version of the map has all the standard features with more capacity:
Source: https://doc.arcgis.com/en/maps-for-powerbi/get-started/about-plus.htm
More basic maps, more geo coordinates to map, more reference layers. The good thing about the reference layers is that you get exposed to the same set of publicly shared feature layers in both free and paid versions of the map, which is a cool thing! There is a search field in the Edit mode of the map that allows you to select and view one of those public layers within your map.
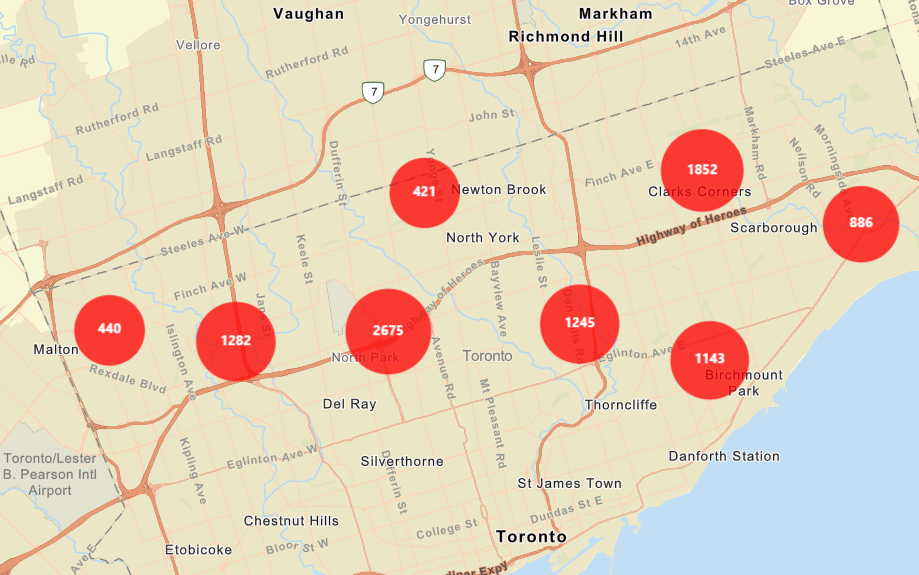
So now, knowing what my limits are, I switched my map theme to clustering and realized that it also had another limit that is not listed on the official ESRI site, the clustering feature in my case was limited to 10,000 geo points vs. the actual dataset of 10,614 stop locations. You can check those numbers if you like.

I still hope that ESRI tech support team will get back to me with my inquiry, otherwise, I will need to find a way to cancel my Plus subscription.
Happy data adventures!
(2018-July-29) Update: the ESRI support team finally reached out to me and helped to resolve the issue, please read my 2nd part of this story: http://datanrg.blogspot.com/2018/07/arcgis-maps-for-power-bi-plus.html
Working with ArcGIS map visualization in Power BI, you always hit that notification point that tells you about more features available in the non-free version of the ArcGIS map, so I wanted to explore this.

I pulled an opened dataset of TTC Routes and Schedules with the route definitions, stop patterns, stop locations, and schedules of the Toronto TTC ground buses and streetcars into my Power BI data model.

With the following table count statistics:
Stops - 10,614 records
Trips - 134,949 records
Routes - 200 records
Stop Times - 5,584,011 records
And this data model helped me to plot all (almost all) stops' geo locations in my ArcGIS map:

My next step was to sign up for the Plus subscription (Paid version of the ArgGIS map) in Power BI. The registration went smoothly, my credit card information has been collected, no warning signs. However, when I tried to sign in again and authenticate myself with my registration email address, I received an error message that something went wrong with ArcGIS Maps for Power BI with apologies for the inconvenience and request to refresh the page or check back later. I contacted the Canadian ESRI tech support but still haven't received any updates for this issue.
So, I was only left with the option to trust the ESRI documentation and check limitations of the free version of the ArcGIS Map in Power BI. If you read the documentation, basically you will get an idea of "more", there a couple of additional new features, but the Plus version of the map has all the standard features with more capacity:
| Included with Power BI | With a Plus subscription |
|---|---|
Basemaps
| |
4 basic basemaps
|
4 basic basemaps and 8 others, including satellite imagery
|
Geocoding
| |
1,500 features per map
|
5,000 features per map
|
100,000 features per month
|
1 million features per month
|
Reference layers
| |
10 reference layers that contain U.S. demographics
|
Access to Esri Living Atlas maps and layers (feature services)
|
Publicly shared feature layers on ArcGIS
|
Publicly shared feature layers on ArcGIS
|
Infographics
| |
Curated gallery of U.S. demographics variables (7 categories)
|
Full access to the ArcGIS GeoEnrichment data browser, including U.S. and global demographics variables
|
More basic maps, more geo coordinates to map, more reference layers. The good thing about the reference layers is that you get exposed to the same set of publicly shared feature layers in both free and paid versions of the map, which is a cool thing! There is a search field in the Edit mode of the map that allows you to select and view one of those public layers within your map.
I still hope that ESRI tech support team will get back to me with my inquiry, otherwise, I will need to find a way to cancel my Plus subscription.
Happy data adventures!
(2018-July-29) Update: the ESRI support team finally reached out to me and helped to resolve the issue, please read my 2nd part of this story: http://datanrg.blogspot.com/2018/07/arcgis-maps-for-power-bi-plus.html
I signed up for a trial and got a similar error. Gave up in the end, best of luck. I have found Mapbox a better mapping visual for Power BI
ReplyDeleteThe ESRI support team finally reached out to me and helped to resolve the issue, please read my 2nd part of this story: http://datanrg.blogspot.com/2018/07/arcgis-maps-for-power-bi-plus.html
ReplyDelete