(2019-Nov-10) Microsoft has recently announced a public preview of the Wrangling data flows in Azure Data Factory (ADF). What used to be called Power Query in Excel, Query Editor in Power BI and Power Query source in SSIS is now available for everyone to explore in ADF data management workspace.
I'm personally OK with the name of this new feature in Azure Data Factory, "Wrangling Data Flows", as long as I know what it does.
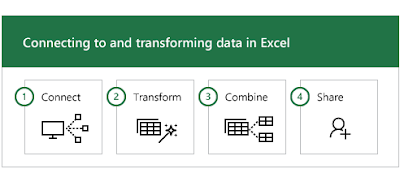
However, if you want to get much more exposure on data transformation with the help of Power Query I would suggest reading and practice with the original engine in Microsoft Excel - Getting Started with Power Query
Also, Cathrine Wilhelmsen has written a really good post on - Comparing Mapping and Wrangling Data Flows in Azure Data Factory. She even went a bit further at the talking about too many data flows in Microsoft ecosystems, that's for you to decide.
And recently, Gaurav Malhotra and Scott Hanselman presented an Azure Friday video with
a brief overview of features that are available in Wrangling Data Flows - How to prepare data using wrangling data flows in Azure Data Factory
Dataset and my use-case to Wrangling Data Flows
Dataset
While reading a Microsoft documentation page on Stream processing pipeline with Azure Databricks, I found a reference to a New York City Taxi Data dataset[1]. This dataset contains data about taxi trips in New York City over a four-year period (2010 – 2013). It contains two types of records: Ride data and fare data. Ride data includes trip duration, trip distance, and pickup and dropoff location. The data is stored in CSV format.
[1] Donovan, Brian; Work, Dan (2016): New York City Taxi Trip Data (2010-2013). University of Illinois at Urbana-Champaign. https://doi.org/10.13012/J8PN93H8
The taxi trip data is organized as follows:
- medallion: a permit to operate a yellow taxi cab in New York City.
- hack license: a license to drive the vehicle.
- vender id: e.g., Verifone Transportation Systems (VTS), or Mobile Knowledge Systems
Inc (CMT).
- pickup datetime: start time of the trip, mm-dd-yyyy hh24:mm:ss EDT.
- dropoff datetime: end time of the trip, mm-dd-yyyy hh24:mm:ss EDT.
- passenger count: number of passengers on the trip, default value is one.
- trip time in secs: trip time measured by the taximeter in seconds.
- trip distance: trip distance measured by the taximeter in miles.
- pickup_longitude and pickup_latitude: GPS coordinates at the start of the trip.
- dropoff longitude and dropoff latitude: GPS coordinates at the end of the trip.pickup
Use-case to Wrangling Data Flows
Brian Donovan and Dan Work from the University of Illinois has pointed out that this dataset "contains a large number of errors. For example, there are several trips where the reported meter distances are significantly shorter than the straight-line distance, violating Euclidean geometry". So, that triggered my interest to add an additional column to this dataset with a straight line distance between two geo-points of pickup and dropoff locations, and that's where I wanted Wrangling Data Flows to help me.

Developing Distance Calculation use-case with Wrangling data flows in Azure Data Factory
Data ingestion
A) I uploaded several months of Trip and Fare taxi data stored in Zip files into my blob storage account:

B) Then I created two data streams to unzip and copy actual CSV data files into my Azure Data Lake Storage Gen2 account:

C) This helped me to populate my ADLS Gen2 storage account containers with the data files for my use-case:

Wrangling Data Flow development
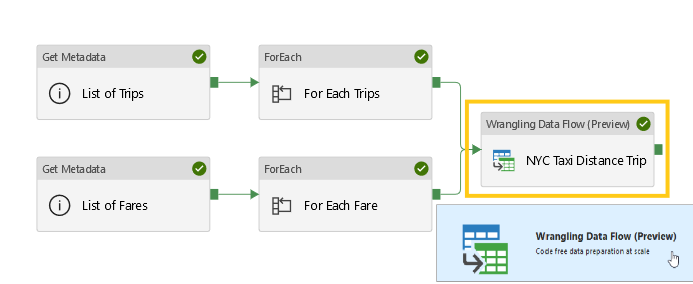
A) In Azure Data Factory I started creating a new data flow and chose it to a Wrangling data flow specifically:


B) Then I was asked to define my input and output datasets. Since Wrangling Data Flows doesn't support multiple data files per dataset, I created my TripData dataset and linked it to the first trip_data_1.csv data file. TaxiSink dataset was linked to an empty folder in my storage account.
Please note Sink Properties that are available to configure, we will get them at the end of my blog post.

C) After finishing all the settings, I now can see a familiar Power Query interface with:
(1) - Two datasets, my initial referenced single file-based TripData dataset, and new UserQuery, which will be used for my output sink dataset.
(2) - At the top, I see a ribbon with buttons to control my table and column transformations
(3) - Transformation steps (first 4 of them) that were automatically created by ADF itself based on metadata of the sourcing data file. And with this, I do recognize all column names that I expected to see, Kudos to Wranglind Data Flows!

D) Now I'm ready to add an additional column to my output dataset which would show a calculated straight line distance between pickup and dropoff geo-locations.
There are several code samples available that explain geometry and calculations steps to find a distance between two coordinates, however, for this Power Query M language-based code I give full credit to Barbar Raney and her article about the same thing - Use Power Query to Calculate Distance. She even has a sample of the Excel workbook to download with the sample dataset and M query code behind it.
Her Excel formula:

Was transformed into this M formula:
Distance_Mi = Number.Acos(Number.Sin([Lat1_Rad]) * Number.Sin([Lat2_Rad]) + Number.Cos([Lat1_Rad]) * Number.Cos([Lat2_Rad]) * Number.Cos([Lon2_Rad]-[Lon1_Rad])) * 3959
And with some modification based on the column names within my dataset, here is a final M query for output dataset to calculate a Distance_Mi column:
This helped me to see new columns and distance calculated in miles:

E) I was super excited that my final calculation worked well on my dataset previewed for the first 100 records. And it was only a matter to save this new data flow and execute it in the Azure Data Factory pipeline on complete ~14.5 million records of my input data file.
As a result, my ADF pipeline run and output data files were created, I saw the new Distance_Mi column was there. However, output files didn't contain any data for all the columns except the first one which I still don't know why.
I tried to use Sink option to combine all output data files into a single file, or I used the option to enclose all values with quotes, the result was the same, not output data at all, however, the number of records in the output file was correct.

I understand that Wrangling Data Flows feature in Azure Data Factory is still in preview and hope that Microsoft will improve and stabilize its functionality.
Here a brief list of my observations, comments, and issues that I've had after building a wrangling data flow use-case:
1) Azure Data Factory has a couple of pre-build templates for Wrangling Data Flows. The TaxiDemo template built on the same New York City taxi data doesn't work; it fails on the last group by aggregation step in the output dataset.
a) I can see both TripData and TripFares input datasets in my Query Editor, no issues. I've used trip_data_1.csv and trip_fare_1.csv of the 2013 year for this test.
b) Output UserQuery fails at the last "Grouped rows" step with a generic error message, "We're sorry, an error occurred during evaluation." However, moving to the "Converting to Decimal Types" step, doesn't generate the error and I can see joined dataset of Trip and Fares data.
c) The first time I ran the ADF pipeline with the wrangling data flow task within, it failed after executing it for 6 minutes with an error message that I didn't save. Right now I'm rerunning the same ADF pipeline, this time it hasn't failed, it ran for 34 minutes and output file is empty, it only contains column headers (vendor_id, total_passenger_count, total_trip_time_in_secs, total_trip_distance, total_trip_fare). Slow performance might be an issue as well; my compute settings were: AzureIntegrationRuntime, computeType = General, coreCount = 8.
2) Currently not all Power Query M functions are supported for data wrangling in ADF. Complete list of currently supported M functions can be found here - https://docs.microsoft.com/en-us/azure/data-factory/wrangling-data-flow-functions
3) Even if M functions support is good in Wrangling Data Flows, not all supported functions are exposed in the ADF UI. You can't find a simple "Add Custom Column" button in your ADF Query Editor, but only Index and Condition columns are available. In order to add a simple custom column, you will need to write an M query code for this.
4) Which leads to my next observation that it would be better and more stable to create a complete M query code in another editor (either Excel or Power BI) and then re-use this code in the ADF Wrangling editor. This actually worked pretty good for me; my Excel-based M query code worked with no issues in my Wrangling Data Flow.
5) Don't try to add new transformation steps to your input sourcing datasets, they won't be saved. ADF user interface will indicate the new changes are made and you will be prompted to save them, but the next time you open your wrangling data flow, your new changes in the input datasets will be lost. I hope this will be resolved by the Microsoft development team; for now, make all of your transformations changes in the UserQuery output dataset only.
6) Currently, Wrangling Data Flows in Azure Data Factory work with CSV files only, I hope that Parquet or other data file types support will be added in the future.
7) Sink properties of the output dataset support creation of single or partitioned multiple data files (default behavior). I also would like to have the support of multiple files or folder with files for input datasets.
8) Output into a single output file is just a combination of two steps: creating multiple partitioned data files and then merging them together (the merging part takes additional time during your data processing).
9) I still don't understand the purpose of the "Reset" and "Done" buttons in the Wrangling Data Flow query editor. More documentation would help to clarify this.
10) And the creation of the output file is the most important issue for me (no output data for all columns except for the first one).
I'm an optimist by nature and believe that it's better to identify issues and find solutions for them!
Hope that my comments will be heard as well.
I'm personally OK with the name of this new feature in Azure Data Factory, "Wrangling Data Flows", as long as I know what it does.
However, if you want to get much more exposure on data transformation with the help of Power Query I would suggest reading and practice with the original engine in Microsoft Excel - Getting Started with Power Query

Also, Cathrine Wilhelmsen has written a really good post on - Comparing Mapping and Wrangling Data Flows in Azure Data Factory. She even went a bit further at the talking about too many data flows in Microsoft ecosystems, that's for you to decide.
And recently, Gaurav Malhotra and Scott Hanselman presented an Azure Friday video with
a brief overview of features that are available in Wrangling Data Flows - How to prepare data using wrangling data flows in Azure Data Factory
Dataset and my use-case to Wrangling Data Flows
Dataset
While reading a Microsoft documentation page on Stream processing pipeline with Azure Databricks, I found a reference to a New York City Taxi Data dataset[1]. This dataset contains data about taxi trips in New York City over a four-year period (2010 – 2013). It contains two types of records: Ride data and fare data. Ride data includes trip duration, trip distance, and pickup and dropoff location. The data is stored in CSV format.
[1] Donovan, Brian; Work, Dan (2016): New York City Taxi Trip Data (2010-2013). University of Illinois at Urbana-Champaign. https://doi.org/10.13012/J8PN93H8
The taxi trip data is organized as follows:
- medallion: a permit to operate a yellow taxi cab in New York City.
- hack license: a license to drive the vehicle.
- vender id: e.g., Verifone Transportation Systems (VTS), or Mobile Knowledge Systems
Inc (CMT).
- pickup datetime: start time of the trip, mm-dd-yyyy hh24:mm:ss EDT.
- dropoff datetime: end time of the trip, mm-dd-yyyy hh24:mm:ss EDT.
- passenger count: number of passengers on the trip, default value is one.
- trip time in secs: trip time measured by the taximeter in seconds.
- trip distance: trip distance measured by the taximeter in miles.
- pickup_longitude and pickup_latitude: GPS coordinates at the start of the trip.
- dropoff longitude and dropoff latitude: GPS coordinates at the end of the trip.pickup
Use-case to Wrangling Data Flows
Brian Donovan and Dan Work from the University of Illinois has pointed out that this dataset "contains a large number of errors. For example, there are several trips where the reported meter distances are significantly shorter than the straight-line distance, violating Euclidean geometry". So, that triggered my interest to add an additional column to this dataset with a straight line distance between two geo-points of pickup and dropoff locations, and that's where I wanted Wrangling Data Flows to help me.
Developing Distance Calculation use-case with Wrangling data flows in Azure Data Factory
Data ingestion
A) I uploaded several months of Trip and Fare taxi data stored in Zip files into my blob storage account:
B) Then I created two data streams to unzip and copy actual CSV data files into my Azure Data Lake Storage Gen2 account:
C) This helped me to populate my ADLS Gen2 storage account containers with the data files for my use-case:
Wrangling Data Flow development
A) In Azure Data Factory I started creating a new data flow and chose it to a Wrangling data flow specifically:
B) Then I was asked to define my input and output datasets. Since Wrangling Data Flows doesn't support multiple data files per dataset, I created my TripData dataset and linked it to the first trip_data_1.csv data file. TaxiSink dataset was linked to an empty folder in my storage account.
Please note Sink Properties that are available to configure, we will get them at the end of my blog post.
C) After finishing all the settings, I now can see a familiar Power Query interface with:
(1) - Two datasets, my initial referenced single file-based TripData dataset, and new UserQuery, which will be used for my output sink dataset.
(2) - At the top, I see a ribbon with buttons to control my table and column transformations
(3) - Transformation steps (first 4 of them) that were automatically created by ADF itself based on metadata of the sourcing data file. And with this, I do recognize all column names that I expected to see, Kudos to Wranglind Data Flows!
D) Now I'm ready to add an additional column to my output dataset which would show a calculated straight line distance between pickup and dropoff geo-locations.
There are several code samples available that explain geometry and calculations steps to find a distance between two coordinates, however, for this Power Query M language-based code I give full credit to Barbar Raney and her article about the same thing - Use Power Query to Calculate Distance. She even has a sample of the Excel workbook to download with the sample dataset and M query code behind it.
Her Excel formula:
Was transformed into this M formula:
Distance_Mi = Number.Acos(Number.Sin([Lat1_Rad]) * Number.Sin([Lat2_Rad]) + Number.Cos([Lat1_Rad]) * Number.Cos([Lat2_Rad]) * Number.Cos([Lon2_Rad]-[Lon1_Rad])) * 3959
And with some modification based on the column names within my dataset, here is a final M query for output dataset to calculate a Distance_Mi column:
1 2 3 4 5 6 7 8 9 10 11 | let
Source = TripData,
ChangedType = Table.TransformColumnTypes(Source, {{"trip_distance", type number}, {"pickup_longitude", type number}, {"pickup_latitude", type number}, {"dropoff_longitude", type number}, {"dropoff_latitude", type number}}),
Lat1_Rad = Table.AddColumn(ChangedType, "Lat1_Rad", each ([pickup_latitude] / 180) * Number.PI),
Lon1_Rad = Table.AddColumn(Lat1_Rad, "Lon1_Rad", each ([pickup_longitude] / 180) * Number.PI),
Lat2_Rad = Table.AddColumn(Lon1_Rad, "Lat2_Rad", each ([dropoff_latitude] / 180) * Number.PI),
Lon2_Rad = Table.AddColumn(Lat2_Rad, "Lon2_Rad", each ([dropoff_longitude] / 180) * Number.PI),
Distance_Mi = Table.AddColumn(Lon2_Rad, "Distance_Mi", each Number.Acos(Number.Sin([Lat1_Rad]) * Number.Sin([Lat2_Rad]) + Number.Cos([Lat1_Rad]) * Number.Cos([Lat2_Rad]) * Number.Cos([Lon2_Rad]-[Lon1_Rad])) * 3959),
RemovedColumns = Table.RemoveColumns(Distance_Mi, {"Lat1_Rad", "Lon1_Rad", "Lat2_Rad", "Lon2_Rad"})
in
RemovedColumns
|
This helped me to see new columns and distance calculated in miles:
E) I was super excited that my final calculation worked well on my dataset previewed for the first 100 records. And it was only a matter to save this new data flow and execute it in the Azure Data Factory pipeline on complete ~14.5 million records of my input data file.
As a result, my ADF pipeline run and output data files were created, I saw the new Distance_Mi column was there. However, output files didn't contain any data for all the columns except the first one which I still don't know why.
I tried to use Sink option to combine all output data files into a single file, or I used the option to enclose all values with quotes, the result was the same, not output data at all, however, the number of records in the output file was correct.
I understand that Wrangling Data Flows feature in Azure Data Factory is still in preview and hope that Microsoft will improve and stabilize its functionality.
Here a brief list of my observations, comments, and issues that I've had after building a wrangling data flow use-case:
1) Azure Data Factory has a couple of pre-build templates for Wrangling Data Flows. The TaxiDemo template built on the same New York City taxi data doesn't work; it fails on the last group by aggregation step in the output dataset.
a) I can see both TripData and TripFares input datasets in my Query Editor, no issues. I've used trip_data_1.csv and trip_fare_1.csv of the 2013 year for this test.
b) Output UserQuery fails at the last "Grouped rows" step with a generic error message, "We're sorry, an error occurred during evaluation." However, moving to the "Converting to Decimal Types" step, doesn't generate the error and I can see joined dataset of Trip and Fares data.
c) The first time I ran the ADF pipeline with the wrangling data flow task within, it failed after executing it for 6 minutes with an error message that I didn't save. Right now I'm rerunning the same ADF pipeline, this time it hasn't failed, it ran for 34 minutes and output file is empty, it only contains column headers (vendor_id, total_passenger_count, total_trip_time_in_secs, total_trip_distance, total_trip_fare). Slow performance might be an issue as well; my compute settings were: AzureIntegrationRuntime, computeType = General, coreCount = 8.
2) Currently not all Power Query M functions are supported for data wrangling in ADF. Complete list of currently supported M functions can be found here - https://docs.microsoft.com/en-us/azure/data-factory/wrangling-data-flow-functions
3) Even if M functions support is good in Wrangling Data Flows, not all supported functions are exposed in the ADF UI. You can't find a simple "Add Custom Column" button in your ADF Query Editor, but only Index and Condition columns are available. In order to add a simple custom column, you will need to write an M query code for this.
4) Which leads to my next observation that it would be better and more stable to create a complete M query code in another editor (either Excel or Power BI) and then re-use this code in the ADF Wrangling editor. This actually worked pretty good for me; my Excel-based M query code worked with no issues in my Wrangling Data Flow.
5) Don't try to add new transformation steps to your input sourcing datasets, they won't be saved. ADF user interface will indicate the new changes are made and you will be prompted to save them, but the next time you open your wrangling data flow, your new changes in the input datasets will be lost. I hope this will be resolved by the Microsoft development team; for now, make all of your transformations changes in the UserQuery output dataset only.
6) Currently, Wrangling Data Flows in Azure Data Factory work with CSV files only, I hope that Parquet or other data file types support will be added in the future.
7) Sink properties of the output dataset support creation of single or partitioned multiple data files (default behavior). I also would like to have the support of multiple files or folder with files for input datasets.
8) Output into a single output file is just a combination of two steps: creating multiple partitioned data files and then merging them together (the merging part takes additional time during your data processing).
9) I still don't understand the purpose of the "Reset" and "Done" buttons in the Wrangling Data Flow query editor. More documentation would help to clarify this.
10) And the creation of the output file is the most important issue for me (no output data for all columns except for the first one).
I'm an optimist by nature and believe that it's better to identify issues and find solutions for them!
Hope that my comments will be heard as well.
Comments
Post a Comment