(2017-Dec-29) Sankey diagram (chart), named after Matthew H Riall Sankey, is a good visualization tool for information flow within a system. It can also identify main players (contributors) to different stages of this flow, where those stages can be textually described and flow thickness its distribution can be attributed to a numeric value of your dataset.
A usual use case for Stanley charts could a population migration between countries, as it has been shown in the Microsoft Power BI demo - https://powerbi.microsoft.com/en-us/blog/visual-awesomeness-unlocked-sankey-diagram/. Or, I've found it's a very fascinated case to show voters flow between first and second rounds in the recent presidential elections in France - French election results: Macron’s victory in charts via @financialtimes

I have been thinking about another case where Sankey diagrams could be used as well, which is a budget analysis, with multiple revenues flow contributing to an overall budget and then spending streams coming out of the same budget.
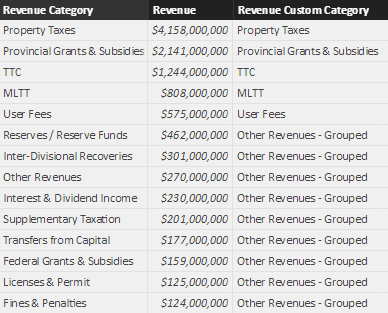
So I took the recent City of Toronto Budget 2018 open dataset: https://www.toronto.ca/city-government/budget-finances/city-budget/. With naturally good pie charts for separate revenue and spending categories. Here is how my two initial datasets looked like in Power BI:


Then for Revenue, I renamed my customer Category column to Source and added one more additional custom column Destination with a value "Budget". For Spending dataset, I added one custom column Source with a value "Budget" and renamed its custom category to Destination. Thus to show how sourcing revenue streams flow to the budget and then they flow from the sourcing budget to the sending destination. Here is how my final Sankey Budget dataset looked like:

Which could be used for the Sankey Power BI visualization that mainly requires Source, Destination, and Weight of the flow.
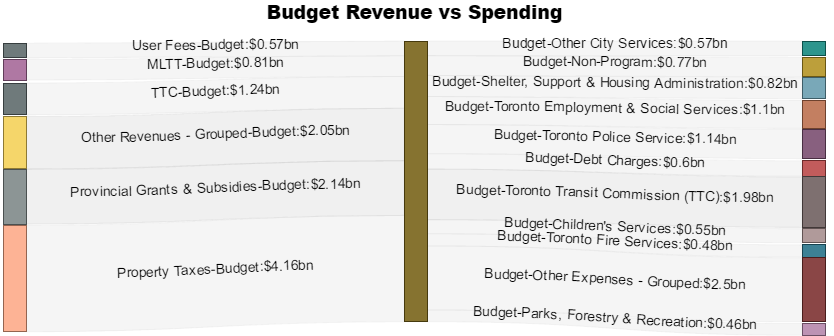
And now it looks like a budget book with revenue and spending data streams together.
Here is my actual report in Power BI that show this all information along with the regular pic charts, please let me know what you think.
A usual use case for Stanley charts could a population migration between countries, as it has been shown in the Microsoft Power BI demo - https://powerbi.microsoft.com/en-us/blog/visual-awesomeness-unlocked-sankey-diagram/. Or, I've found it's a very fascinated case to show voters flow between first and second rounds in the recent presidential elections in France - French election results: Macron’s victory in charts via @financialtimes

I have been thinking about another case where Sankey diagrams could be used as well, which is a budget analysis, with multiple revenues flow contributing to an overall budget and then spending streams coming out of the same budget.
So I took the recent City of Toronto Budget 2018 open dataset: https://www.toronto.ca/city-government/budget-finances/city-budget/. With naturally good pie charts for separate revenue and spending categories. Here is how my two initial datasets looked like in Power BI:

Then for Revenue, I renamed my customer Category column to Source and added one more additional custom column Destination with a value "Budget". For Spending dataset, I added one custom column Source with a value "Budget" and renamed its custom category to Destination. Thus to show how sourcing revenue streams flow to the budget and then they flow from the sourcing budget to the sending destination. Here is how my final Sankey Budget dataset looked like:
Which could be used for the Sankey Power BI visualization that mainly requires Source, Destination, and Weight of the flow.
And now it looks like a budget book with revenue and spending data streams together.
Here is my actual report in Power BI that show this all information along with the regular pic charts, please let me know what you think.
I read your blog nice explanation, Thank you for share this valuable information with us. Keep share more content MSBI Online Training
ReplyDeleteThis comment has been removed by the author.
ReplyDeleteThis comment has been removed by the author.
ReplyDeletevery interesting post. power BI training in Chennai
ReplyDeleteYou blog post is just completely quality and informative. Many new facts and information which I have not heard about before. Keep sharing more blog posts.
ReplyDeleteJava interview questions and answers
Java training in Chennai | Java training institute in Chennai | Java course in Chennai
Java training in Bangalore | Java training institute in Bangalore | Java course in Bangalore
Java interview questions and answers
I simply want to give you a huge thumbs up for the great info you have got here on this post.
ReplyDeleteData Science course in Chennai | Best Data Science course in Chennai
Data science course in bangalore | Best Data Science course in Bangalore
Data science course in pune | Data Science Course institute in Pune
Data science online course | Online Data Science certification course-Gangboard
Data Science Interview questions and answers