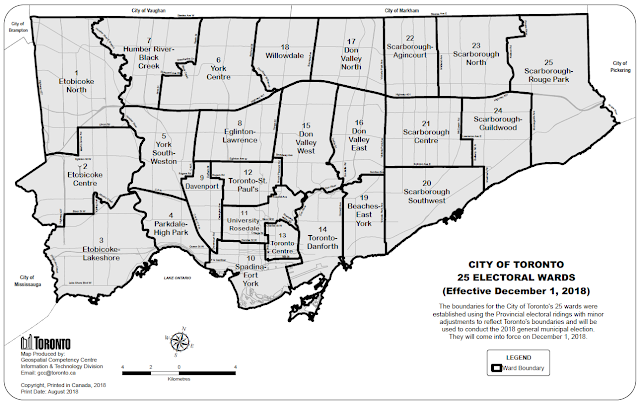
(2018-Dec-31) Back in July of 2018, Ontario provincial government of Canada decided to decrease the number of Toronto city wards from 47 to 25. That was affirmed by conducting the municipal election a few months later in October of 2018 to select councils for those newly shaped 25 wards.
This whole story triggered my interest to see if these new 25 wards could be portrayed with the shape maps in Power BI.
The updated Toronto City wards geo-information can be found in the city Open Data Catalogue. And I plan to be working with a widely used WGS 84 format for geo-coordinates. This format is directly supported by 3D Maps in Excel, however, for Power BI consumption it has to be additionally converted.
Usually, the WGS 84 geo shape data is represented by a set of files:

where each of them contributes to the process of locating points, lines and polygons on a map.
Shape filename extensions:
.cpg - used to specify the code page for identifying the character encoding to be used
.prj - projection format; the coordinate system and projection information, a plain text file describing the projection
.dbf - attribute format; columnar attributes for each shape
.shp.xml - geospatial metadata in XML format
.sbn and .sbx - a spatial index of the geo features
.shp - shape format; the feature geometry itself
.shx - shape index format; a positional index of the feature geometry to allow seeking forward and backward quickly
.txt - metadata of the .dbf file, list of columns
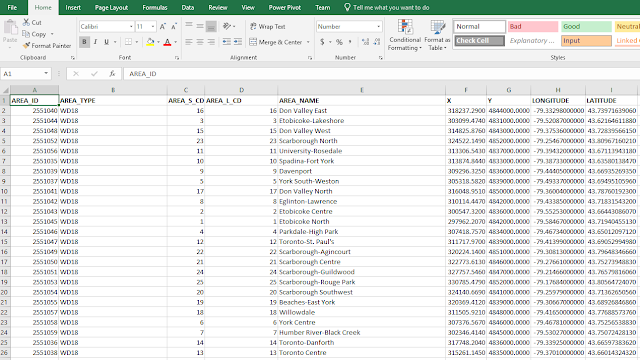
Just to be sure that WARD_WGS84.dbf file contains a list of new Toronto city wards and their geo descriptive attributes, we can open and check this file in Excel:
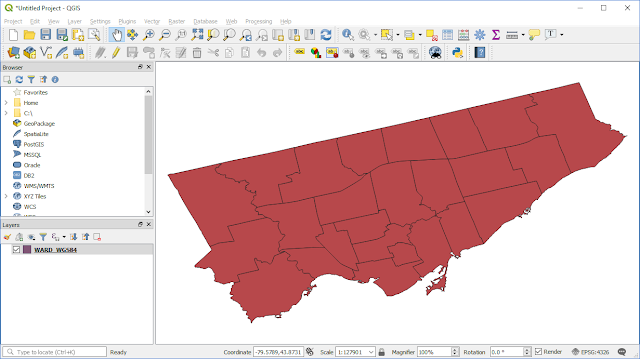
And to be fully immersed into the geo shape data we can always double check its layout using one of the available GIS tools. In my case, I've used QGIS, and it helped me to see all 25 polygons that are being drawn using geometry data from the WARD_WGS84.shp file.
File conversion:
Currently, we can use custom shape maps in Power BI as long as they are in the TopoJSON format. And there are several tools that we can use to convert WGS 84 shapefiles into TopoJSON files, Map Shaper is one of them.
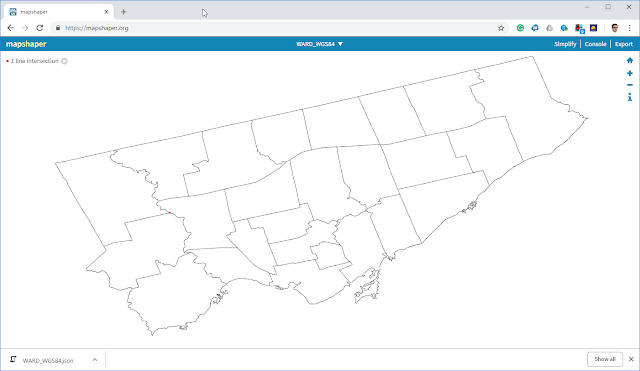
I would suggest not to convert individual shapefiles with this tool, but to provide a whole zip file instead that would help to include both geo-coordinates for polygons as well as textual and key descriptors from a .dbf file too. As a result, you will get a single TopoJSON file that can be further used in Power BI.
Power BI custom shape map:
First, let's build a data model in Power BI using data from the WARD_WGS84.dbf file.
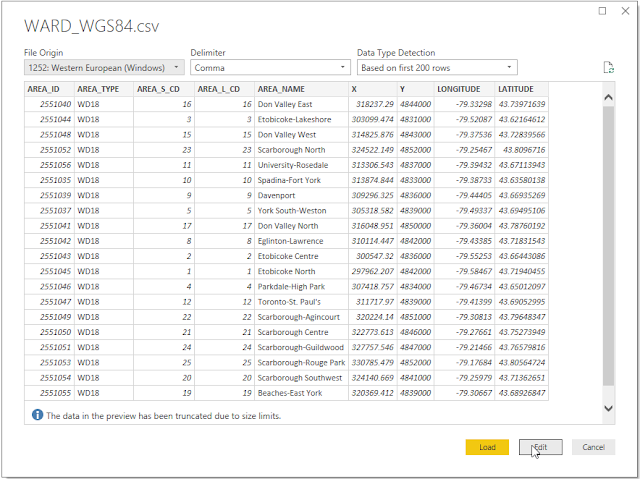
1) Data extraction: the WARD_WGS84.dbf file can be easily converted into a CSV alternative version and connected to:
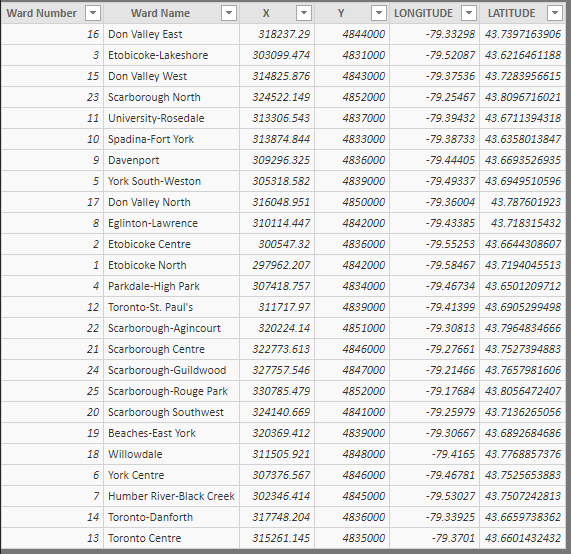
2) Data Table: after removing some of the attributes in Query editor, the final table is left with six columns:
- Ward Number
- Ward Name
- and X & Y geo coordinates
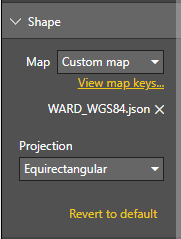
3) Custom Shape Map: by clicking [ + Add Map] button in the Power BI Shape Map visualization UI you can add a custom geo map to your report. This will be the time to use newly converted TopoJSON file from the WGS 84 shapes.
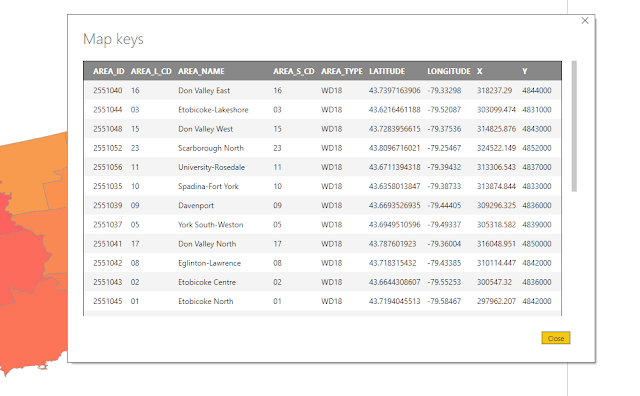
4) Shape Map Keys: it's worthwhile to visually explore your custom map keys by clicking the "View map keys..." highlighted link in your shape settings:
5) Shape Map: after validating my custom shape map keys and placing [Ward Name] data column from my dataset into the Location field I can visually confirm the Power BI shows all 25 Toronto City wards (geo polygons) correctly:
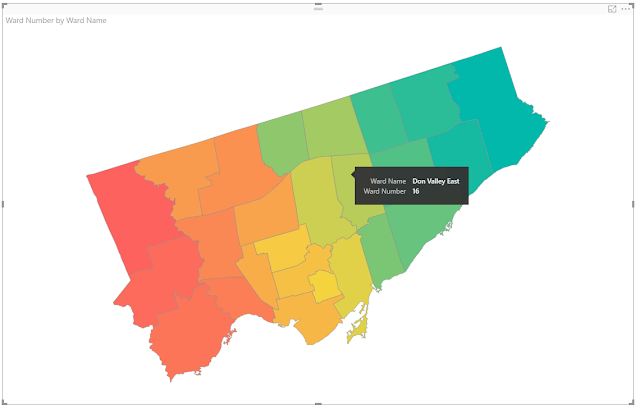
The only thing that I believe is lacking in the current version of the Shape Map visualization in Power BI is the way legend information for each individual geo polygons is being shown. At this moment this type of information is only available by hovering over a shaped polygon of your interest and a popup tooltip will provide this data for you.
Perhaps, this can be improved in future releases.
Let's keep exploring map visualization capabilities in Power BI!
This whole story triggered my interest to see if these new 25 wards could be portrayed with the shape maps in Power BI.

The updated Toronto City wards geo-information can be found in the city Open Data Catalogue. And I plan to be working with a widely used WGS 84 format for geo-coordinates. This format is directly supported by 3D Maps in Excel, however, for Power BI consumption it has to be additionally converted.
Usually, the WGS 84 geo shape data is represented by a set of files:

where each of them contributes to the process of locating points, lines and polygons on a map.
Shape filename extensions:
.cpg - used to specify the code page for identifying the character encoding to be used
.prj - projection format; the coordinate system and projection information, a plain text file describing the projection
.dbf - attribute format; columnar attributes for each shape
.shp.xml - geospatial metadata in XML format
.sbn and .sbx - a spatial index of the geo features
.shp - shape format; the feature geometry itself
.shx - shape index format; a positional index of the feature geometry to allow seeking forward and backward quickly
.txt - metadata of the .dbf file, list of columns
Just to be sure that WARD_WGS84.dbf file contains a list of new Toronto city wards and their geo descriptive attributes, we can open and check this file in Excel:

And to be fully immersed into the geo shape data we can always double check its layout using one of the available GIS tools. In my case, I've used QGIS, and it helped me to see all 25 polygons that are being drawn using geometry data from the WARD_WGS84.shp file.

File conversion:
Currently, we can use custom shape maps in Power BI as long as they are in the TopoJSON format. And there are several tools that we can use to convert WGS 84 shapefiles into TopoJSON files, Map Shaper is one of them.

I would suggest not to convert individual shapefiles with this tool, but to provide a whole zip file instead that would help to include both geo-coordinates for polygons as well as textual and key descriptors from a .dbf file too. As a result, you will get a single TopoJSON file that can be further used in Power BI.
Power BI custom shape map:
First, let's build a data model in Power BI using data from the WARD_WGS84.dbf file.
1) Data extraction: the WARD_WGS84.dbf file can be easily converted into a CSV alternative version and connected to:

2) Data Table: after removing some of the attributes in Query editor, the final table is left with six columns:
- Ward Number
- Ward Name
- and X & Y geo coordinates

3) Custom Shape Map: by clicking [ + Add Map] button in the Power BI Shape Map visualization UI you can add a custom geo map to your report. This will be the time to use newly converted TopoJSON file from the WGS 84 shapes.

4) Shape Map Keys: it's worthwhile to visually explore your custom map keys by clicking the "View map keys..." highlighted link in your shape settings:

5) Shape Map: after validating my custom shape map keys and placing [Ward Name] data column from my dataset into the Location field I can visually confirm the Power BI shows all 25 Toronto City wards (geo polygons) correctly:

The only thing that I believe is lacking in the current version of the Shape Map visualization in Power BI is the way legend information for each individual geo polygons is being shown. At this moment this type of information is only available by hovering over a shaped polygon of your interest and a popup tooltip will provide this data for you.
Perhaps, this can be improved in future releases.
Let's keep exploring map visualization capabilities in Power BI!
What great information. This expands the Power Bi tool kit immensely. Thank you for this post Rayis.
ReplyDeleteI'm glad you liked it, Robert. Various map visualizations along with different use cases of them in Power BI could lead to very interesting application scenario. It only takes time to explore them!
ReplyDelete